
or-MOCI: Oregon MULTIVARIATE OCEAN CLIMATE INDicator
What is OR-MOCI?
The OR-MOCI synthesizes a number of local and regional ocean and atmospheric conditions that represent, in a holistic manner, the coastal conditions along the Oregon coast. OR-MOCI includes data that are readily available from the Internet so the indicator can be updated and shared regularly via this website.
OR-MOCI encompasses over 30 years, capturing warming events impacting the Northeast Pacific across decades, like El Niño and marine heatwaves. It also captures changes in timing and magnitude of the shift from downwelling to coastal upwelling, which impact temperature conditions. These conditions and their variability affect the marine ecosystem, therefore OR-MOCI could be useful in ecosystem-based fisheries and wildlife management.
Most recent OR-MOCI: Updated through March 2026 (winter). This season, OR-MOCI values vary from positive to negative, though still fall within normal conditions.
Data are provided for AMJ 1992 - JFM 2026 [csv].
Please cite this dataset as:
García-Reyes, M., Koval, G., and Sydeman, W.J. (2025). Oregon Multivariate Ocean Climate Indicator (MOCI) [Data set, V2]. Farallon Institute website, http://www.faralloninstitute.org/moci-or. Accessed [Date].
What data are included in MOCI?
MOCI include seasonal averages of the following data:
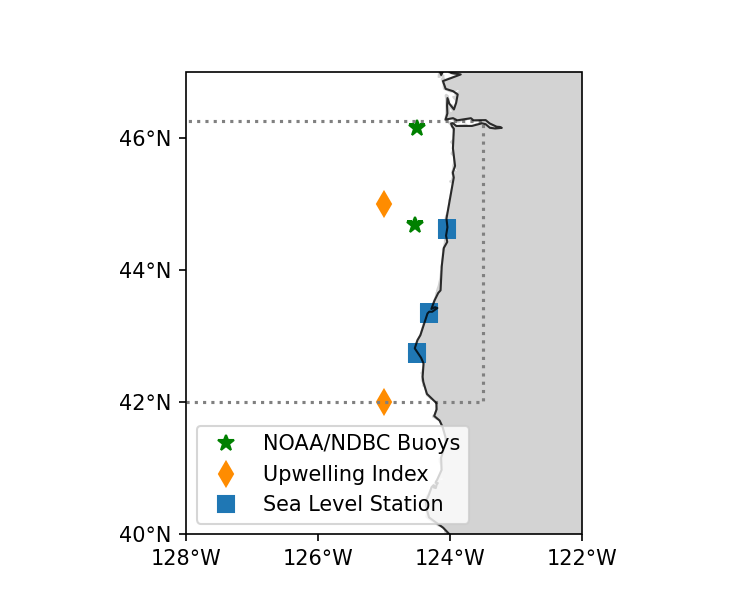
Upwelling Index, NOAA [link]
Sea level from shore stations, NOAA [link]
Alongshore wind, sea surface temperature, air temperature, sea level pressure from NOAA buoys [link]
Regional climate indices:
MEI: Multivariate ENSO Index [link]
PDO: Pacific Decadal Oscillation [link]
NOI: Northern Oscillation Index [link]
NPGO: North Pacific Gyre Oscillation [link]
*Note: OR-MOCI is calculated for a span of 30 years. Gaps in data are filled in using ERA5 reanalysis V5 and NOAA OISST V2.1 data.
How to interpret MOCI?
Positive anomalous (red) values reflect warmer than normal conditions with weaker upwelling or stronger downwelling, often associated with El Niño, while large negative (blue) values reflect cooler than normal conditions and stronger upwelling. However, we discuss below a more specific interpretation of these values, which depends on the season.
What drives these conditions?
As a multivariate index, OR-MOCI reflects variability in multiple indicators of environmental variables. However, the importance of each of these variables in driving the variability of conditions varies by season.
The figure below shows the individual importance of each variable in determining the variability of OR-MOCI for each season. Length of the bar indicates the importance of each variable, and the color signifies the relationship (red is a positive influence, blue is a negative one). Across regions, the largest drivers are related to sea level and wind-driven upwelling and downwelling. Water and air temperature is also related to these variables in all seasons but spring, when it is also related to river runoff. The Pacific Decadal Oscillation (PDO) is the climate indicator most relevant to the variability of the region, which is associated with sea surface temperatures.
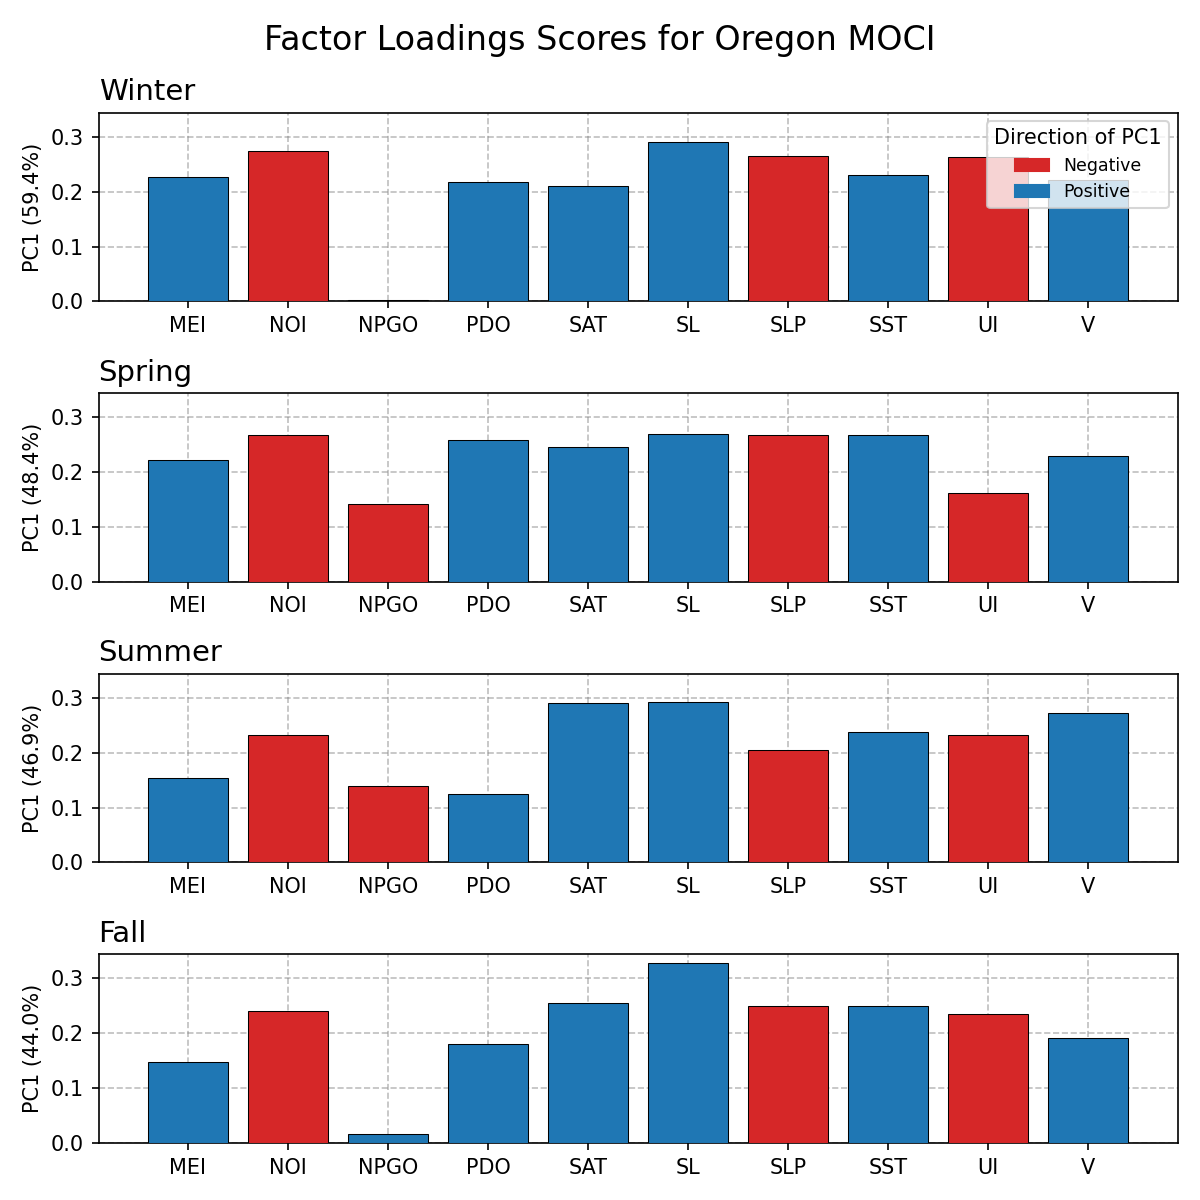
Figure labels: MEI: Multivariate El Niño Southern Oscillation (ENSO) Index, NOI: Northern Oscillation Index, NPGO: North Pacific Gyre Oscillation, PDO: Pacific Decadal Oscillation, SAT: Surface Air Temperature; SL: Sea Level, SLP: Sea Level Atmospheric Pressure, SST: Sea Surface Temperature, UI: Upwelling Index, V: Alongshore Wind Stress.
More information about MOCI:
García-Reyes M, Sydeman WJ. 2017. California Multivariate Ocean Climate Indicator (MOCI) and marine ecosystem dynamics. Ecological Indicators, 72, 521-529. [pdf]
Sydeman W, Thompson SA, García-Reyes M, Kahru M, Peterson W, Largier J. 2014. Multivariate ocean-climate indicators (MOCI) for the Central California Current: Environmental change: 2010-2014. Progress in Oceanography, 120, 352-369. [pdf]